From Words to Data: Mapping Famine Drivers Through Term Frequency
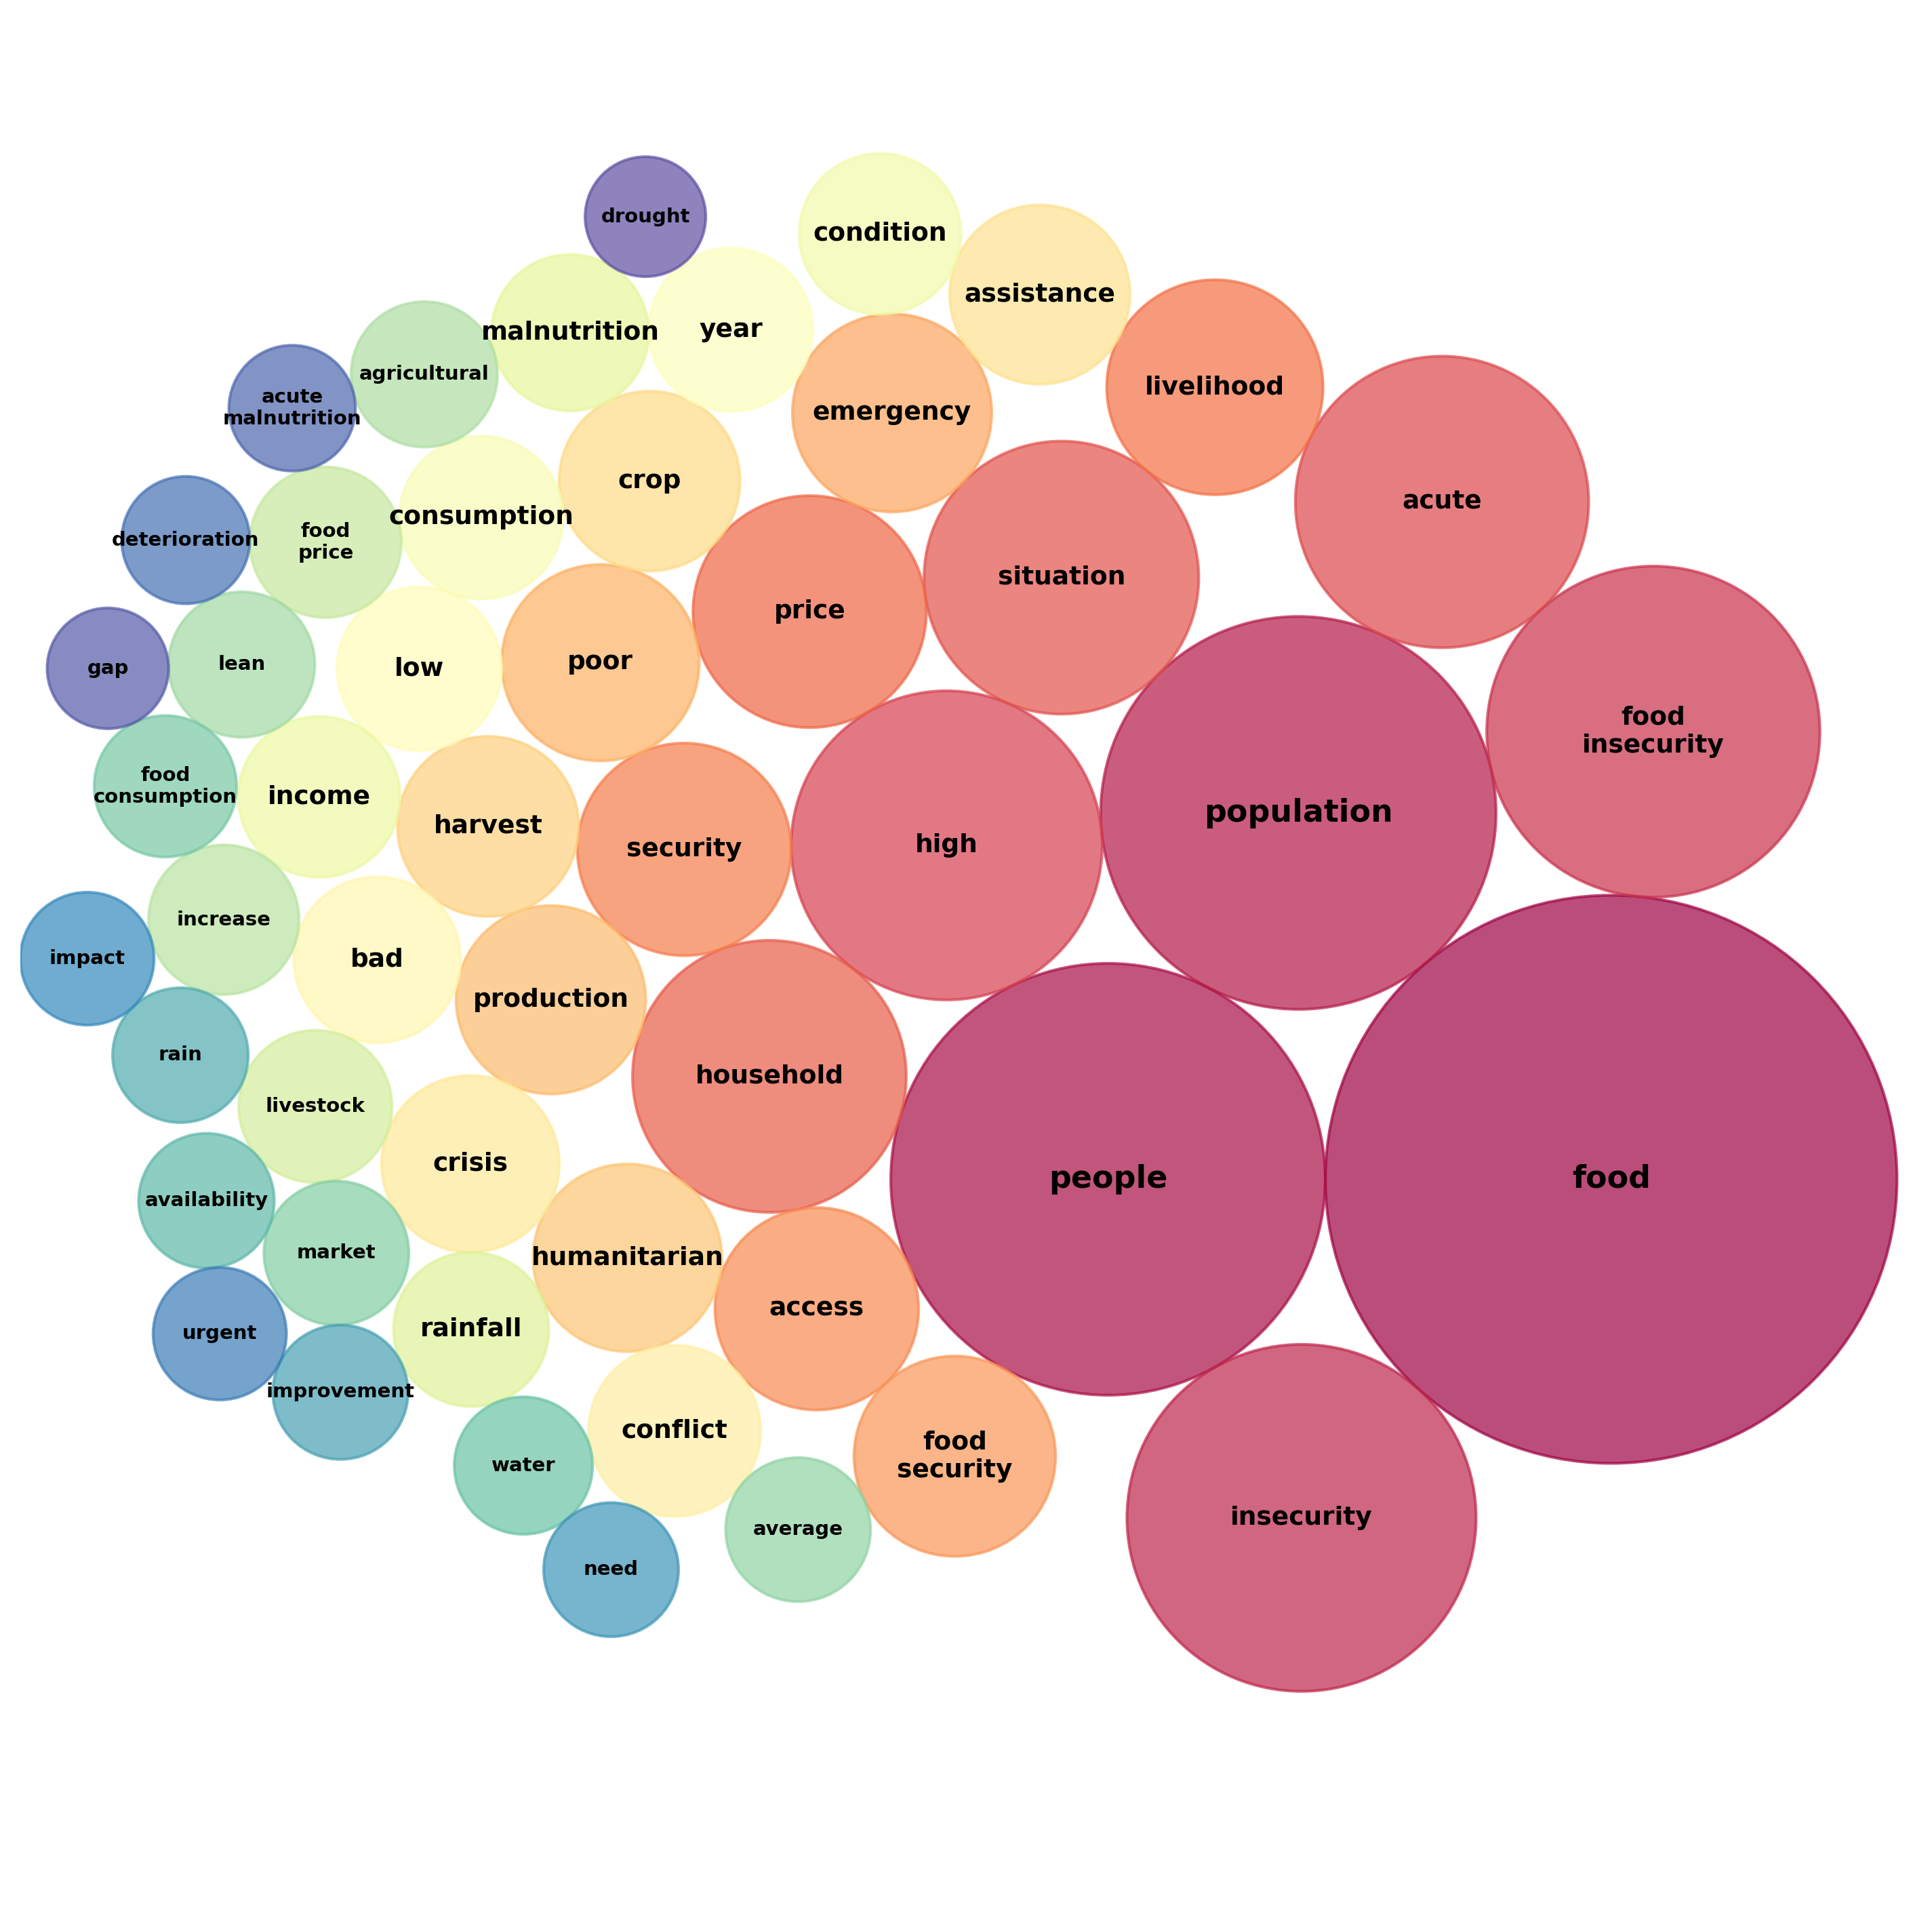
In IPC reports, words are never neutral: their recurrence forms the digital footprint of a real-world emergency. Textual analysis reveals that the bigram 'food insecurity' unsurprisingly dominates the dataset, frequently paired with critical terms like 'acute' and 'malnutrition'. However, it is the underlying drivers that shape this semantic map. The high frequency of words like 'price' highlights economic shocks and barriers to food access, while the agricultural production cluster ('production', 'harvest', 'crop') captures the immediate impact of climate factors on the ground. In this context, counting words means mapping the boundaries of hunger.
Top 50 Words (Bubble Chart)
The Crisis Algorithm: Drivers of Food Insecurity
Behind the IPC data architecture lies the convergence of macroeconomic, climatic, and social forces. By analyzing the semantic patterns within the reports, the primary catalysts of hunger emerge clearly across three interconnected macro-drivers:
- Key Words: price, food price, access, income, market.
- Market Dynamics: Hunger unfolds primarily as a purchasing power crisis. Inflationary spikes build invisible financial barriers: food remains on shelves but becomes entirely unaffordable for vulnerable households.
- Key Words: production, harvest, crop, drought, rain.
- Agricultural Collapse: This reflects the systemic breakdown of local livelihoods (livelihood). Weather anomalies and droughts destroy crops upstream, triggering physical supply deficits and rural income loss.
- Key Words: conflict, displacement, humanitarian assistance, food consumption.
- Breaking Point: Conflicts and forced displacement shatter local trade networks and drive populations to flee. At this tipping point, food consumption plummces, making external humanitarian aid vital to bridge survival deficits.
Mapping the Geography of Crisis Drivers
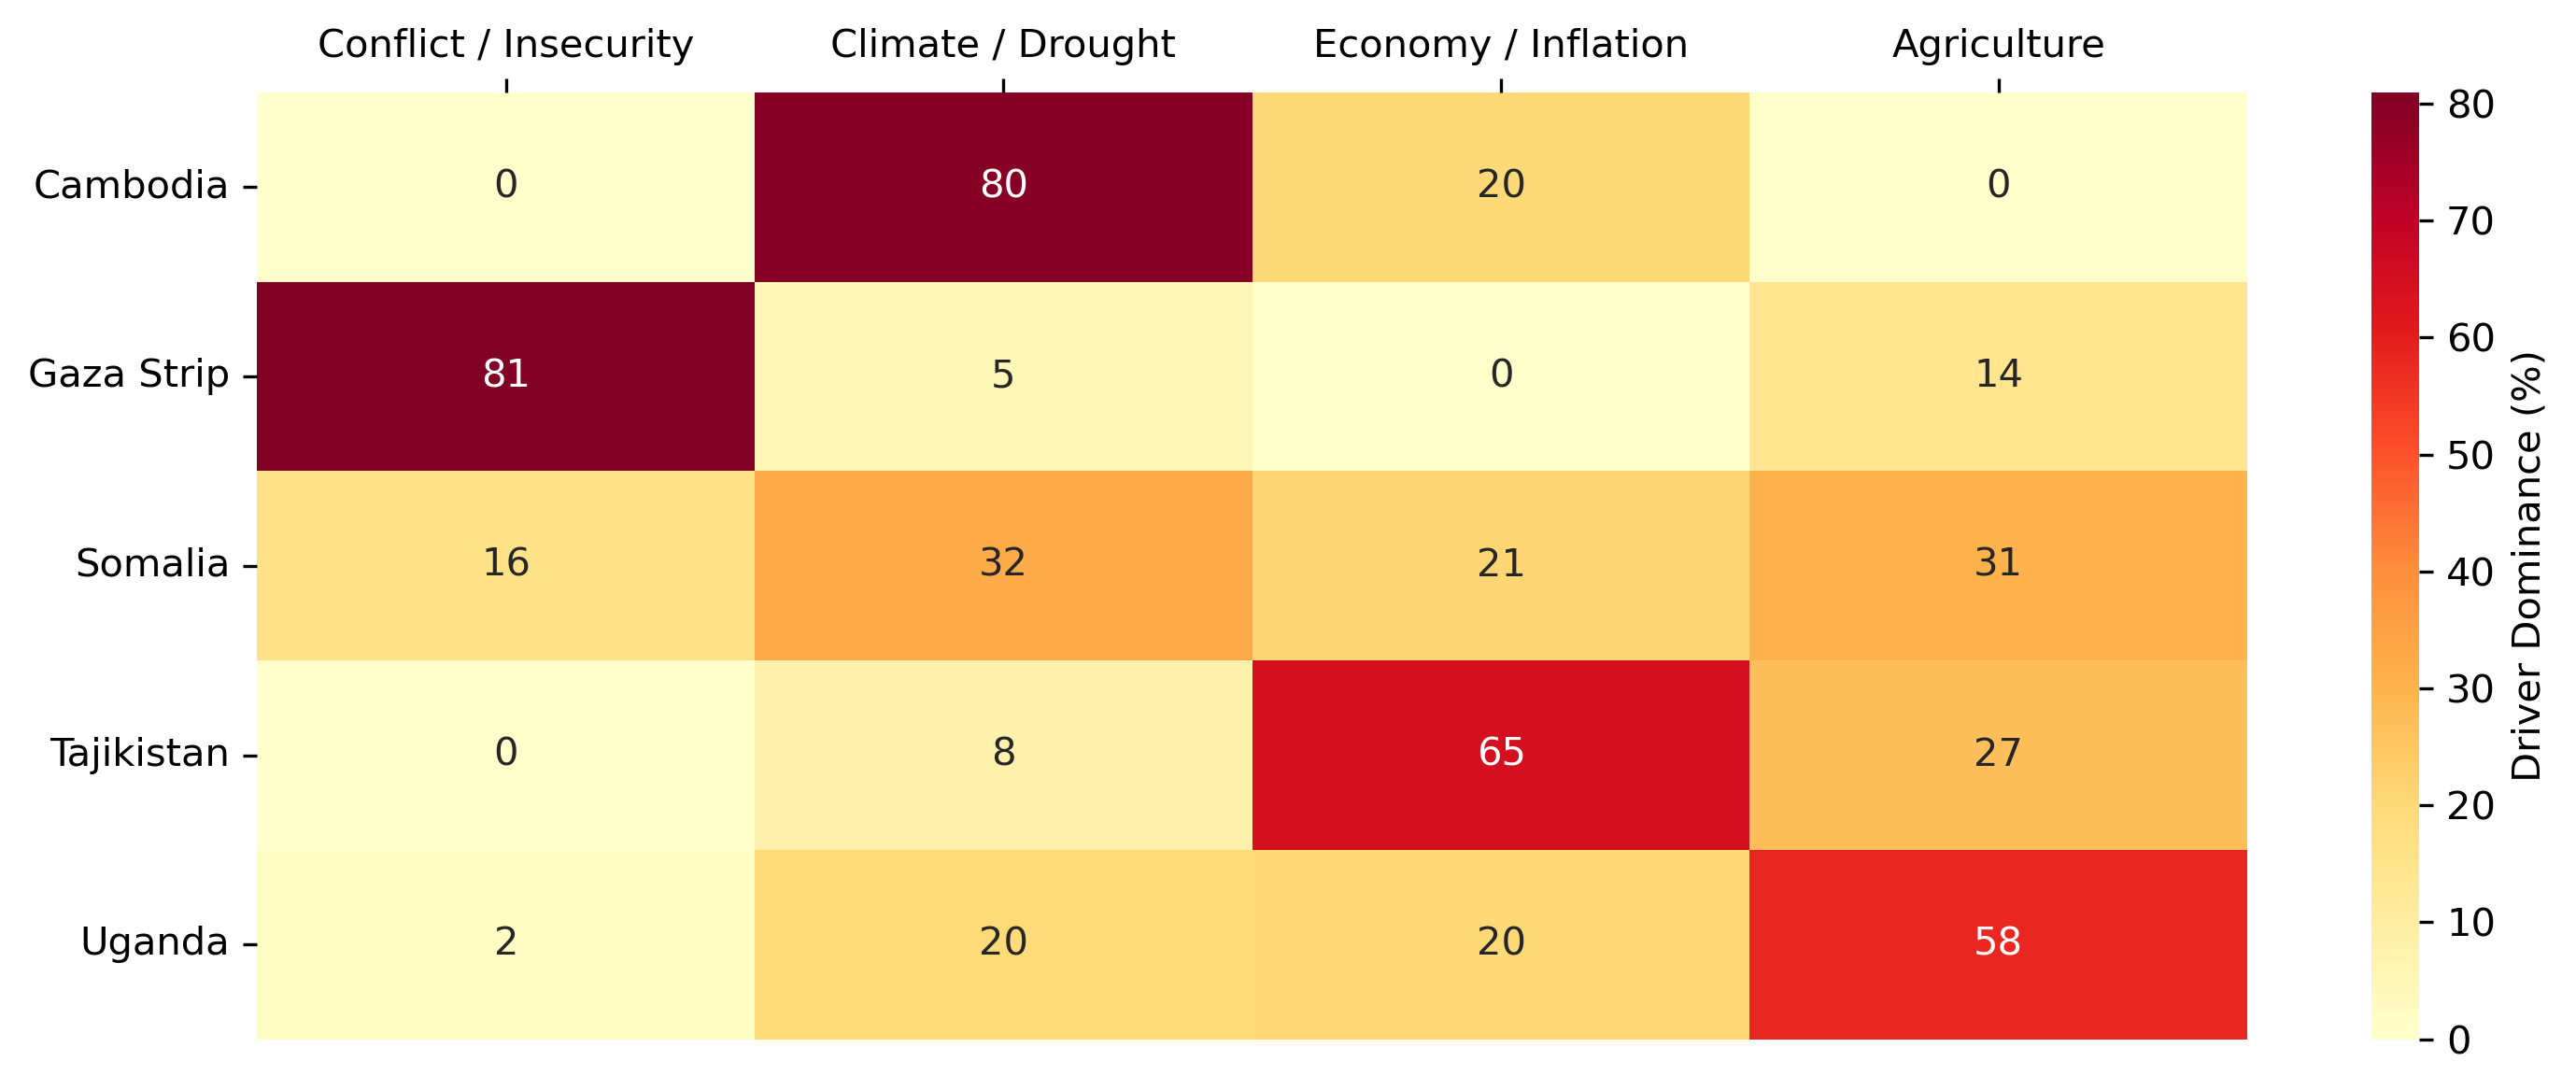
While the macroeconomic, climatic, and structural drivers of hunger are universal, their impact is intensely localized. By normalizing the frequency of these critical terms, we can generate a focused heatmap highlighting a selected group of highly vulnerable nations. The visualization below reveals the unique crisis signature of these specific regions: some nations are predominantly scarred by conflict and displacement, while others suffer primarily from the collapse of agricultural production due to climate extremes. This heatmap translates semantic prevalence into a stark geographic reality.
Architecting the Semantic Engine: The NLP Pipeline
To move beyond simple word counts and uncover the hidden semantic structures of food crises, we implemented an advanced Natural Language Processing (NLP) pipeline. The goal was not just to read the reports, but to let the data organize itself into coherent thematic clusters.
1. Anonymization & Tag Removal (GLiNER)
Before diving into the vocabulary, it was crucial to anonymize the texts to prevent a specific type of bias. By utilizing GLiNER (Generalist Model for Named Entity Recognition using Bidirectional Transformer), we identified and masked named entities such as specific locations, organizations, and individuals. Rooted in the BERT family of bidirectional transformers, GLiNER was chosen because, as demonstrated in its founding paper, it can significantly outperform massive Large Language Models (LLMs) on zero-shot Named Entity Recognition tasks, while remaining highly efficient. The primary goal of this anonymization was to prevent the clustering algorithm from grouping reports based on geopolitical similarity (e.g., countries located in the same region), forcing it instead to cluster documents based on the similarity of the underlying drivers inherent to food insecurity.
Original Text
"The 8th analysis cycle on the Integrated Food Security Classification Framework (IPC) of DRC held in December 2012 identified 6.4 million people affected by a situation of food and livelihood crises, 77 regions have been classified in phase 3 and 8 regions in Phase 4 throughout DRC."
GLiNER Anonymized Text
"The 8th analysis cycle on the Integrated Food Security Classification Framework (IPC) of [AFFECTED_AREA] held in [DATE] identified 6.4 million people affected by a situation of food and livelihood crises, [AFFECTED_AREA] have been classified in phase 3 and [AFFECTED_AREA] in Phase 4 throughout [AFFECTED_AREA]."
2. Noise Reduction & Vectorization
The first challenge was cleaning the data. Since the texts were already anonymized, we focused on standardizing the vocabulary. We removed standard English stopwords along with a custom list of domain-specific noise words, and applied lemmatization to reduce words to their base linguistic forms (e.g., merging 'prices' and 'price'). Finally, using TF-IDF (Term Frequency-Inverse Document Frequency), we transformed the cleaned text into a high-dimensional mathematical space, capturing both unigrams and bigrams to preserve context (e.g., "food insecurity" instead of just "food").
3. Dimensionality Reduction
Since the TF-IDF matrix contained thousands of features, we applied LSA (Latent Semantic Analysis) via TruncatedSVD to extract the most important underlying concepts. However, to combat the "curse of dimensionality" before clustering, we utilized UMAP (Uniform Manifold Approximation and Projection) to further compress the semantic space into 5 dimensions. UMAP acts as a topological lens, pulling semantically similar reports close together while pushing unrelated ones apart.
4. Clustering Strategies
To categorize the reports into distinct crisis typologies, we tested two different clustering algorithms. First, K-Means, an approach that partitions the space into a predefined number of clusters, perfect for segmenting broad macro-trends. Second, HDBSCAN, a density-based algorithm capable of discovering clusters of varying shapes and sizes while isolating "noise" (reports that don't fit into any clear pattern).
Model Evaluation: To determine which methodology best captured the semantic boundaries of the dataset, we compared their performance across standard clustering metrics. The table below summarizes the quantitative evaluation of both models on the reduced TF-IDF space.
| Metrica | K-Means | HDBSCAN | |
|---|---|---|---|
| 0 | Numero di Cluster trovati | 10 | 11 |
| 2 | Silhouette Score | 0.380 | 0.386 |
| 3 | Calinski-Harabasz Index | 280.6 | 219.0 |
| 4 | Davies-Bouldin Index | 0.889 | 0.884 |
5. Topic Extraction (c-TF-IDF)
Once the clusters are formed, the critical next step is understanding what they actually represent. To do this—across both our TF-IDF and Dense Embedding pipelines—we used class-based TF-IDF (c-TF-IDF), a technique popularized by the paper "BERTopic: Neural topic modeling with a class-based TF-IDF procedure". This methodology represents a paradigm shift because it decouples the semantic clustering of documents from the extraction of their topic representations. By treating all documents within a single cluster as one massive "super-document", c-TF-IDF generates highly coherent and distinctive keywords, empirically outperforming traditional generative models like LDA. This guarantees high topic diversity and human-readable accuracy for translating mathematical groupings into clear, actionable narratives of conflict, drought, and economic collapse.
Example: HDBSCAN Cluster 7 (Agricultural Shocks & Dry Spells)
To understand the power of the clustering pipeline combined with c-TF-IDF, let's look at two completely different reports that the algorithm grouped into the same cluster (HDBSCAN Cluster 7). Despite originating from different countries (Zimbabwe and Uganda) and different periods, they describe an identical chain of events: a climate shock (prolonged dry spells) that destroys crop production and stresses livestock, forcing rural households to rely entirely on local markets. However, because of soaring prices and low incomes, these families face restricted access to food, resulting in a severe drop in dietary diversity.
To maximize visual clarity, we have highlighted in blue the top cluster keywords extracted by c-TF-IDF (livestock, market, income, dry spell, normal, adequate, water, diversity). We have also highlighted in yellow other highly significant words that both texts share despite referring to different crises, showing how structurally identical these situations are.
Zimbabwe (Apr 2013 - Apr 2014)
"Agriculture is a key livelihoods activity for the majority of Zimbabwe's rural population. Mainly because of the poor rainfall season quality, production of major crops in 2012/13 fell compared to last season's harvest. Livestock (cattle, sheep and goats) were in a fair to good condition in April 2013. Grazing and water for livestock were generally adequate in most parts of the country save for the communal areas, where it was, as is normal, generally inadequate. Currently, staple cereals are generally available throughout the country from both own production and the market, but low incomes and higher than normal prices of staple cereals are limiting household access. There is continued limited diversity of food consumed by rural households... Rainfall distribution was erratic... The first effective rains were followed by a long dry spell which was coupled by very high temperatures... Most of the households in the affected areas will still depend on the market for their basic food needs."
Uganda (Jan 2017 - Feb 2018)
"Food in markets is easily accessed and affordable because prices have declined and the households have adequate purchasing power. They have good nutrition levels because they are able to eat two or more time a day with a good dietary diversity. Currently access to livestock products is good because of the available pasture and water. However, livestock production is expected to decline due to expected dry conditions... The households in these regions all suffered the effects of prolonged dry spells that stressed most of the crops and reduced yields... However, as the production in the second season is anticipated to be normal and above normal for some areas... For those whose livelihood depends mainly on livestock, the situation may not improve due to the expected dry spell in January and February, which is likely to reduce the availability of water and pasture... They have poor purchasing power as their incomes are low..."
Phase 2: Deep Semantic Embeddings
While TF-IDF effectively captures statistical word frequencies, it can struggle with the nuanced context of complex narratives. To address this, we advanced the pipeline to a purely semantic approach.
1. Dense Semantic Embeddings (BGE-M3)
Using the state-of-the-art BAAI/bge-m3 model, we transformed the anonymized reports into dense, high-dimensional vectors (1024 dimensions). Rooted in the powerful XLM-RoBERTa architecture (part of the BERT family of encoder-only transformers), this model was chosen for its massive 8192-token context window—allowing it to ingest entire reports without fragmenting the text—and its exceptional ability to map technical synonyms (e.g., "prolonged water stress" and "rainfall deficit") into the exact same semantic space across multiple languages.
2. Geographic Entropy & Validation
After applying UMAP (reducing to 5 dimensions) and clustering with K-Means and HDBSCAN, we needed to rigorously validate the semantic purity of the clusters. We calculated the Geographic Entropy of each cluster to prove that the algorithm wasn't simply grouping reports by country. High entropy scores confirmed that our clusters successfully aggregated reports across different continents based strictly on their underlying food insecurity drivers.
3. Clustering Strategies
As in the previous phase, we evaluated the performance of K-Means and HDBSCAN, but this time applying them to the dense semantic space generated by BGE-M3.
Model Evaluation: The table below summarizes the quantitative evaluation of both clustering algorithms on the reduced Dense Embedding space. Notably, HDBSCAN achieved a significantly higher Silhouette Score (0.501) compared to the TF-IDF baseline, confirming that the semantic embeddings form tighter and more distinct conceptual clusters.
| Metrica | K-Means | HDBSCAN | |
|---|---|---|---|
| 0 | Numero di Cluster trovati | 7 | 7 |
| 2 | Silhouette Score | 0.397 | 0.501 |
| 3 | Calinski-Harabasz Index | 1177.2 | 340.0 |
| 4 | Davies-Bouldin Index | 0.804 | 0.752 |
4. Extracting Dense Topics (c-TF-IDF)
Just as we did in Phase 1, we applied the c-TF-IDF methodology to the clusters generated by the dense BGE-M3 embeddings. Because the clusters were now formed based on deep semantic meaning rather than just word co-occurrence, the resulting "super-documents" fed into the c-TF-IDF algorithm yielded even richer and more conceptually unified keywords, providing highly precise crisis narratives.
Example 1: Semantic Cluster (Economic Impacts of COVID-19)
To demonstrate the power of dense semantic embeddings, let's examine two texts from completely different contexts (El Salvador and Zambia) that BGE-M3 placed in the exact same cluster.
The dense embedding model understands that these texts describe the same underlying driver—economic constraints caused by pandemic restrictions—even though they use completely different phrasing to describe it. A traditional model might miss the connection between "reduced livelihood opportunities" and "income losses due to mobility restrictions", but dense embeddings capture the shared semantic space of economic shock.
We have highlighted in blue the cluster keywords extracted by c-TF-IDF (covid-19, pandemic, income). We have also highlighted in yellow the different phrases used to describe the triggering economic conditions, which the algorithm correctly recognized as conceptually aligned in the embedding space.
El Salvador (October 2020 - February 2021)
"These groups have experienced income losses due to mobility and transportation restrictions due to the COVID-19 pandemic... This reduction of income limits affected households' access to basic services and food."
Zambia (July - September 2022)
"The current vulnerability in Zambia has been driven by a high incidence of poverty, the impact of the COVID-19 pandemic, macroeconomic instability... primarily driven by shocks such as prolonged dry spells, flooding, reduced livelihood opportunities due to restrictions linked to COVID-19."
Example 2: Semantic Cluster (Mixed Climate & Economic Shocks)
The true power of BGE-M3 dense embeddings is grouping texts by meaning when the vocabulary and register are completely different. Traditional keyword-based systems (like TF-IDF) fail when authors use different synonyms or technical jargon to describe the exact same event.
In this semantic cluster, we find reports describing food insecurity caused by a combination of bad weather and a struggling economy. Notice how the author of the Lesotho report uses simple, direct terms like "dry spells", "high temperatures", and "economic challenges". Conversely, the author of the Zambia report describes the exact same phenomena using highly technical jargon: "hydro meteorological hazard shocks" and "macroeconomic instability". The model ignores the stylistic differences and correctly maps both to the same semantic concept: a dual climate-economic crisis.
Lesotho (May 2024 - March 2025)
"Prolonged dry spells, high temperatures, and economic challenges have left people in rural Lesotho facing severe food insecurity."
Zambia (August 2023 - March 2024)
"...The current vulnerability in Zambia has been driven by high incidence of poverty, occurrence of macroeconomic instability and exposure to hydro meteorological hazard shocks. The food insecurity this season was primarily driven by climate related shocks and hazards."